CityDigitalTwin's microclimate solver is tested against published wind-tunnel experiments and full-scale field measurements: benchmark cases from the urban wind datasets of the Architectural Institute of Japan (AIJ), a Tokyo Polytechnic University (TPU) wind-tunnel experiment on air temperature around a building, and a wind-tunnel experiment on evaporation from open water. This page covers the wind, tree-canopy, temperature and humidity cases. Every result is compared point by point, at the exact locations where the data was taken.
The cases start with one building in a wind tunnel and build up to a real city district and trees measured in the field, then add heat and moisture: air temperature around a building in stable and unstable air, and evaporation from open water. Each quantity is normalised as in the original experiment.
Case A · Building aerodynamics
Isolated high-rise building
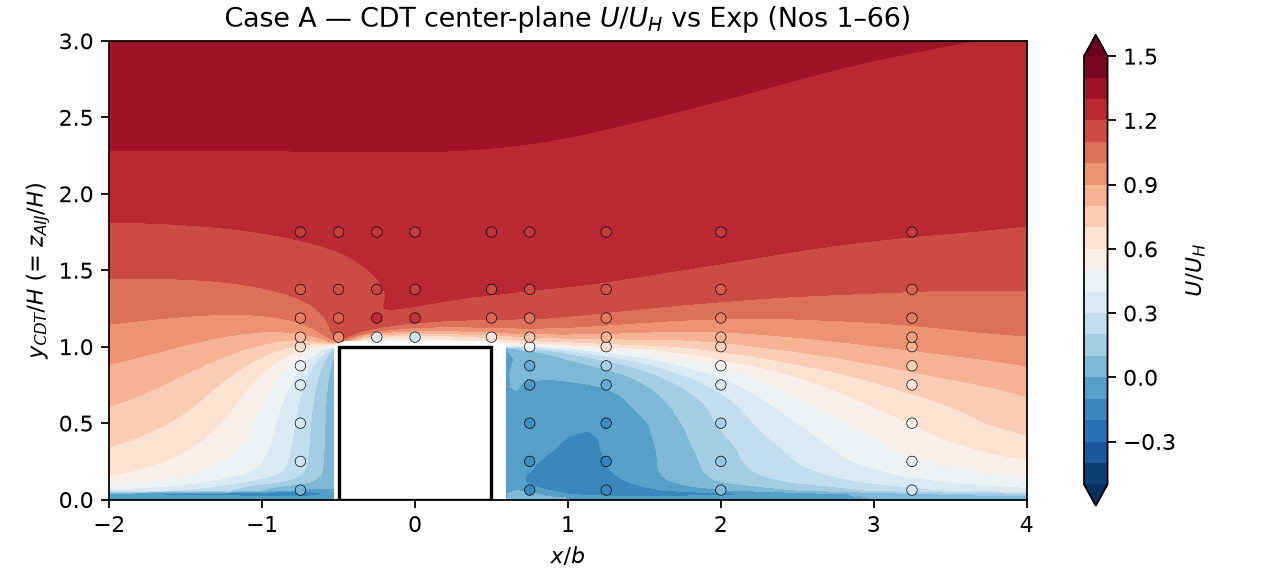
The reference test for flow around a single 1:1:2 building: separation at the roof edge, the recirculating wake, and corner acceleration at pedestrian height.
Wind tunnel · 186 points
0.96R
0.97FAC2
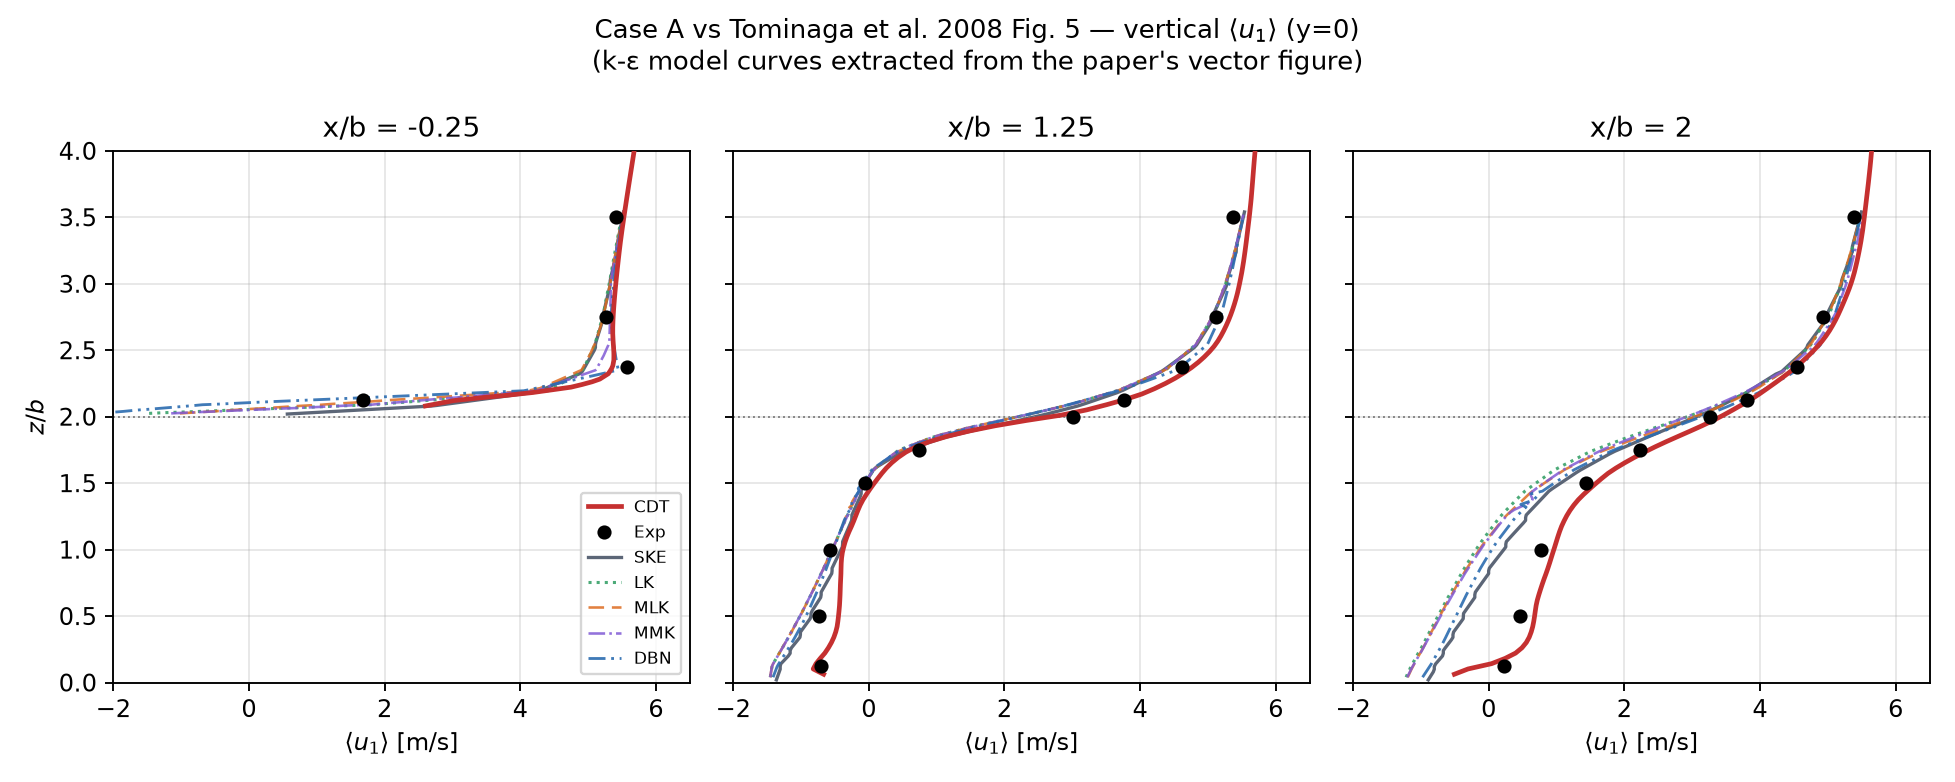
Figure A1. Mean streamwise wind speed (U/UH) on the vertical centre plane through the building, simulated by CityDigitalTwin, with wind blowing from left to right. The circles are the 66 wind-tunnel measurements on this plane, coloured on the same scale, so a circle that blends into its surroundings marks close agreement. Blue areas are slow or reversed flow in the wake. Axes are scaled by building width b horizontally and height H vertically, so the 1:1:2 building appears square.Figure A2. Vertical profiles of mean streamwise velocity on the centre plane, above the roof (x/b = −0.25) and in the wake (x/b = 1.25 and 2). Black dots: wind-tunnel measurements. Red line: CityDigitalTwin (LES). Other lines: five k-ε (RANS) turbulence models reported by Tominaga et al. (2008), extracted from the paper's figure and drawn in its line styles. At x/b = 2 the measured flow near the ground is already moving forward again; the k-ε models still predict reverse flow there, while CityDigitalTwin follows the measurements.
AIJ Urban Wind Environment benchmark, Case A; Tominaga et al. (2008), J. Wind Eng. Ind. Aerodyn. 96
Case D · Tall building in the city
High-rise among city blocks
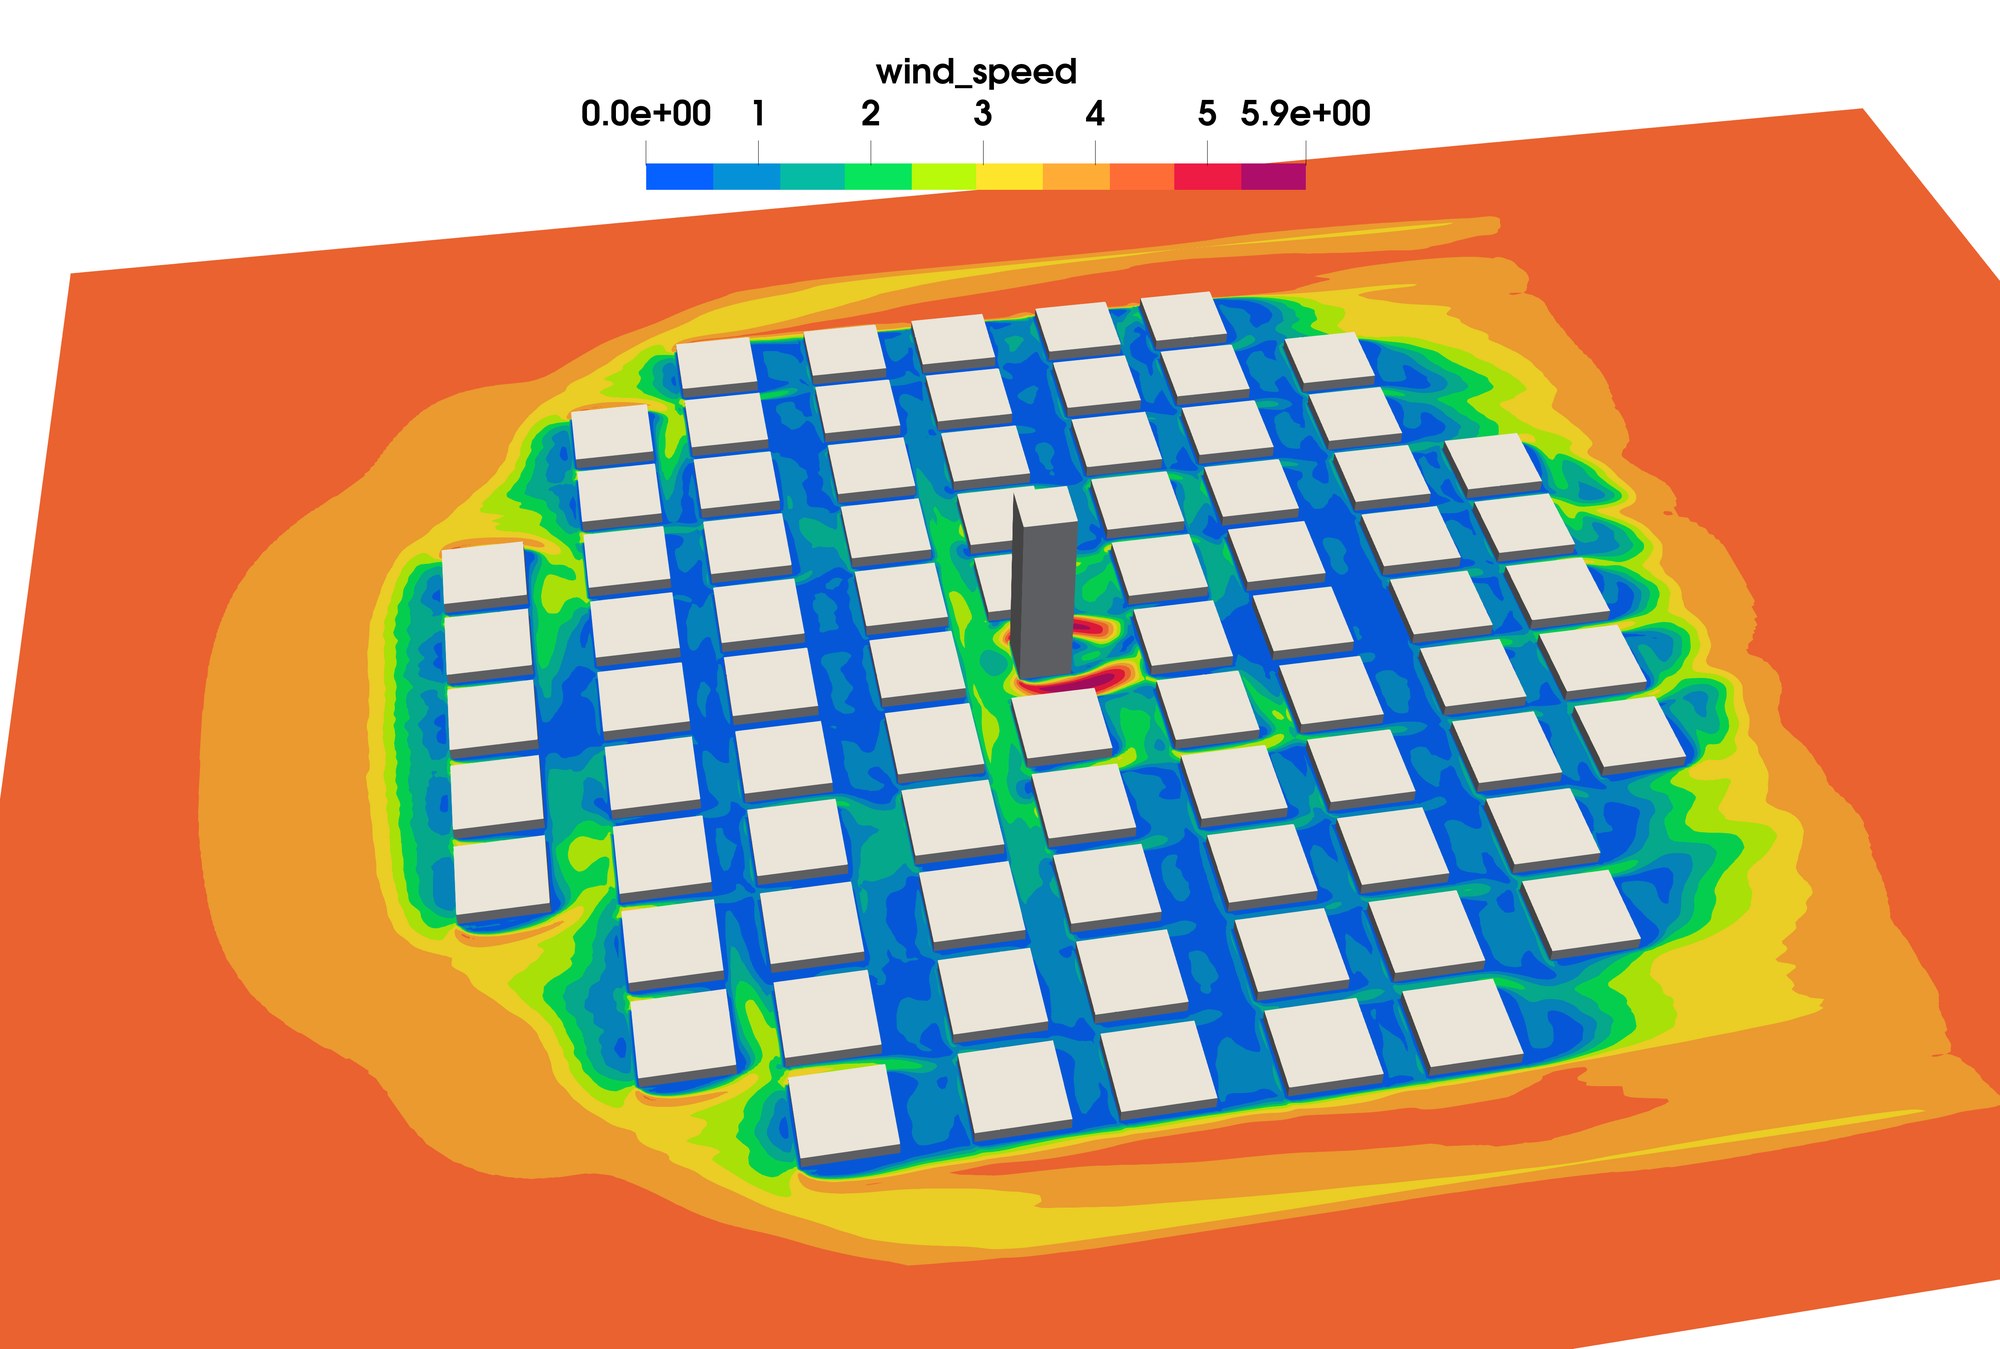
A high-rise tower standing among city blocks, where a tall building brings strong wind down to the street. Wind speed is compared at pedestrian height.
Wind tunnel · 33 points
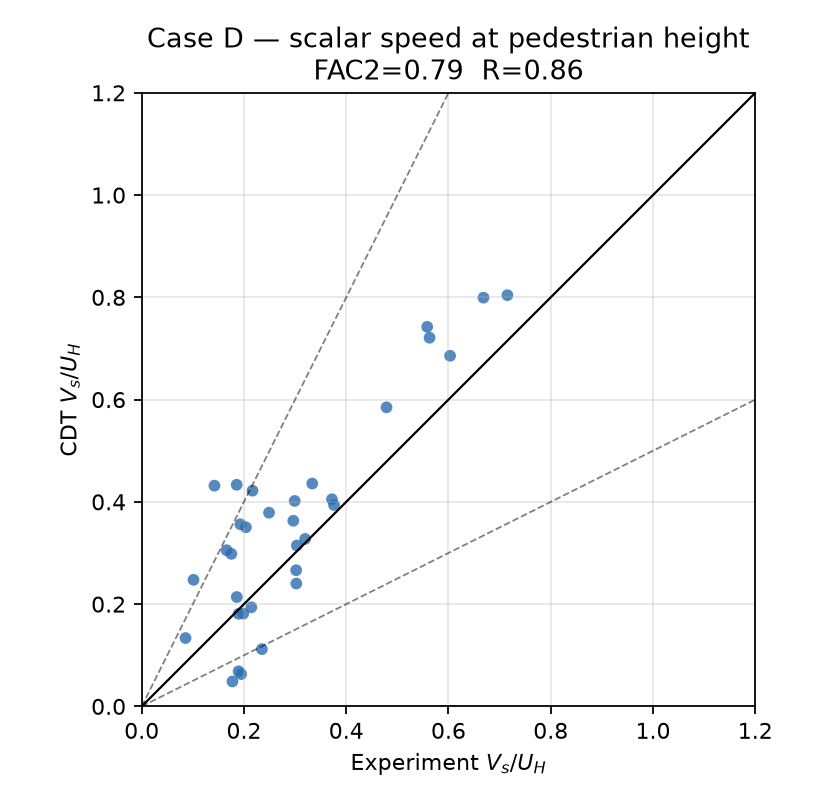
0.86R
0.79FAC2
Figure D1. Simulated wind speed (m/s, wind-tunnel scale) around the high-rise and the surrounding blocks. Blue streets are sheltered; the red patches at the base of the tower show the faster wind it brings down to street level.Figure D2. Wind speed at pedestrian height (Vs/UH): CityDigitalTwin against the wind-tunnel measurement at each of the 33 points. Points on the solid line agree exactly; points between the dashed lines are within a factor of two of the measurement.
AIJ Urban Wind Environment benchmark, Case D
Case F · Real city district
Shinjuku, Tokyo
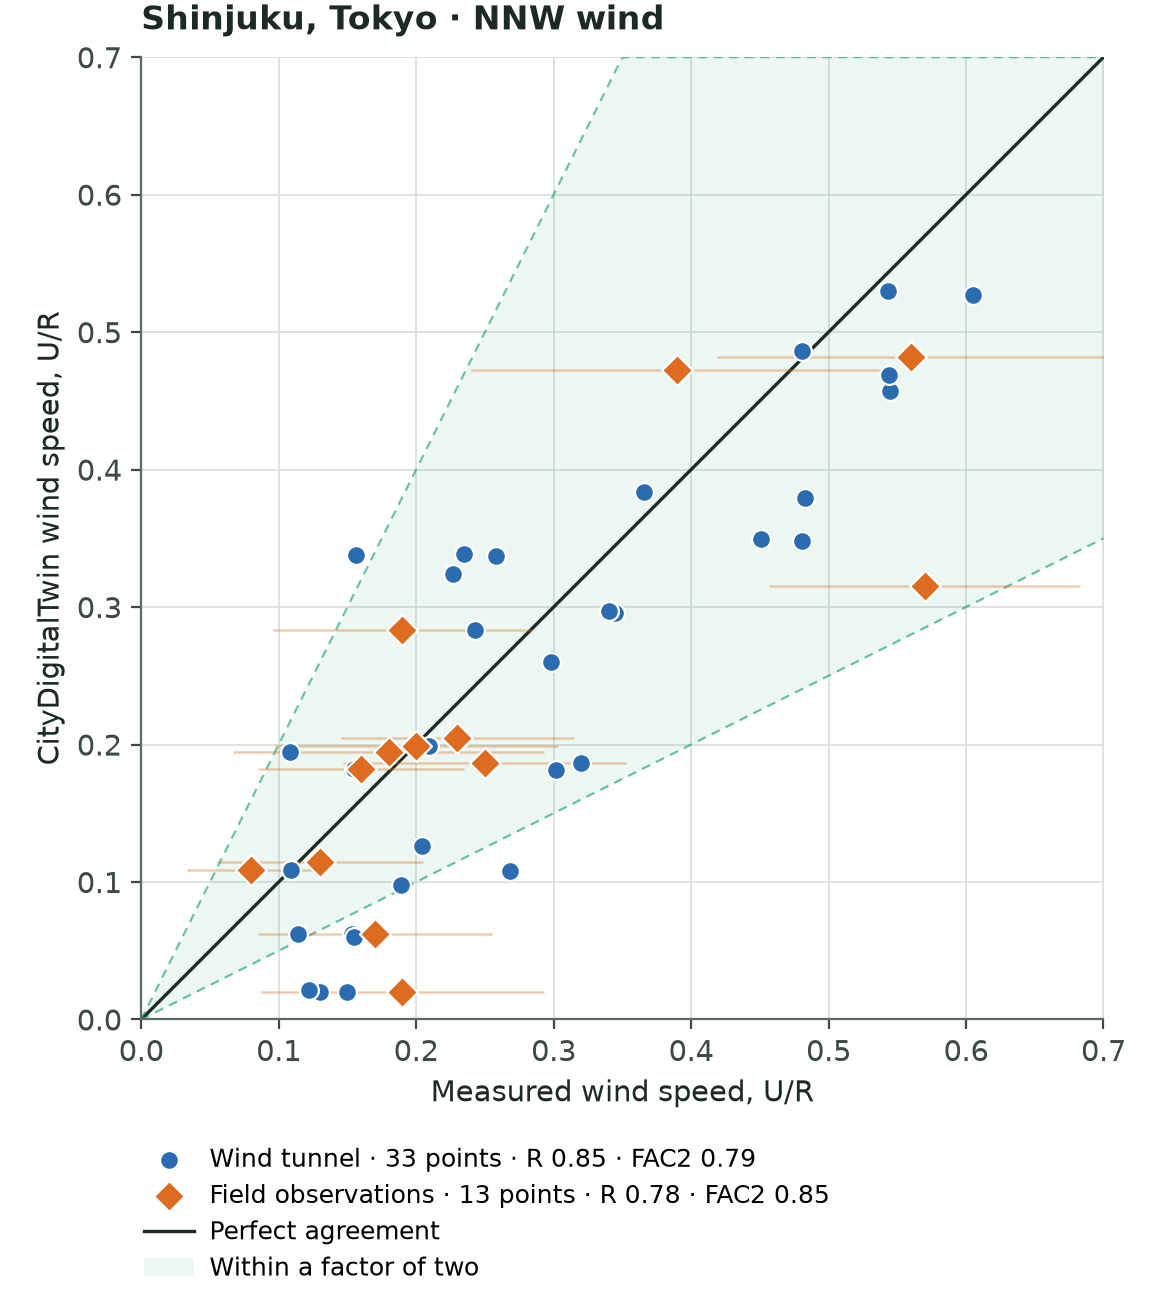
High-rise Shinjuku as it stood in 1978, for a north-north-westerly wind. The model is checked against both a wind-tunnel model and full-scale wind observations recorded near street level.
Wind tunnel · 33 points
0.85R
0.79FAC2
Field observations · 13 points
0.78R
0.85FAC2
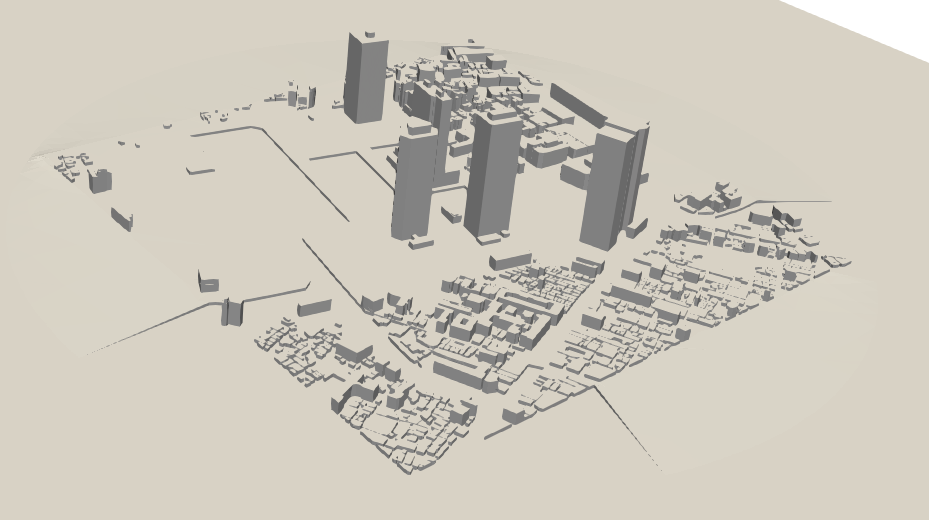
Figure F1. The Shinjuku district as it stood in 1978: the high-rise cluster and the surrounding low-rise blocks, as modelled in the simulation. Building geometry from the AIJ Case F dataset (Zenodo, doi:10.5281/zenodo.15589621), CC BY 4.0.Figure F2. Wind speed (U/R) for the NNW wind: CityDigitalTwin against the wind-tunnel model (33 points) and the full-scale field observations (13 points). Points on the solid line agree exactly; points in the shaded band are within a factor of two of the measurement.
AIJ Urban Wind Environment benchmark, Case F
Case G · Trees
Pine windbreak
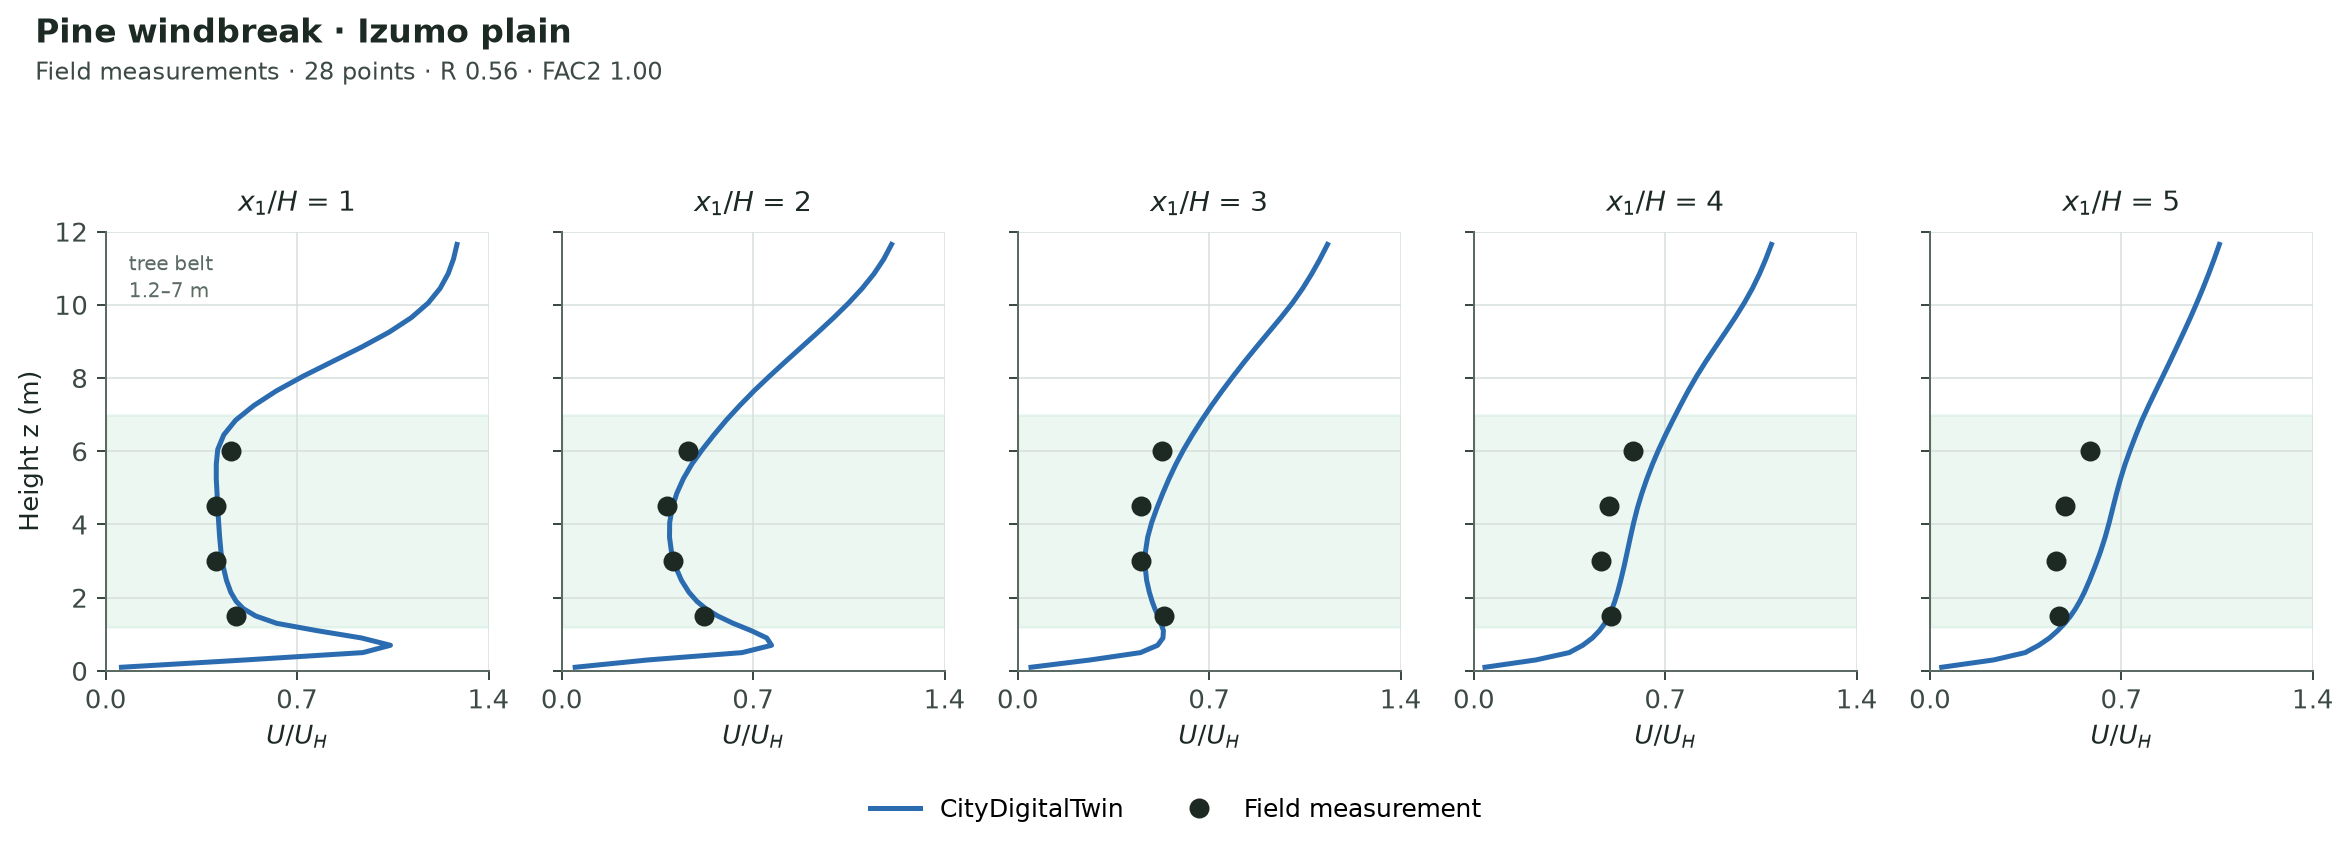
Wind sheltering behind a 7 m belt of black pines on the Izumo plain in Japan, measured in the field. Trees are modelled as a porous canopy with aerodynamic drag, and the result does not depend on the simulation time step.
R is low here because the measured wind speed barely varies across the 28 points, so correlation says little; FAC2 is the meaningful measure for this case.
Field measurements · 28 points
0.56R
1.00FAC2
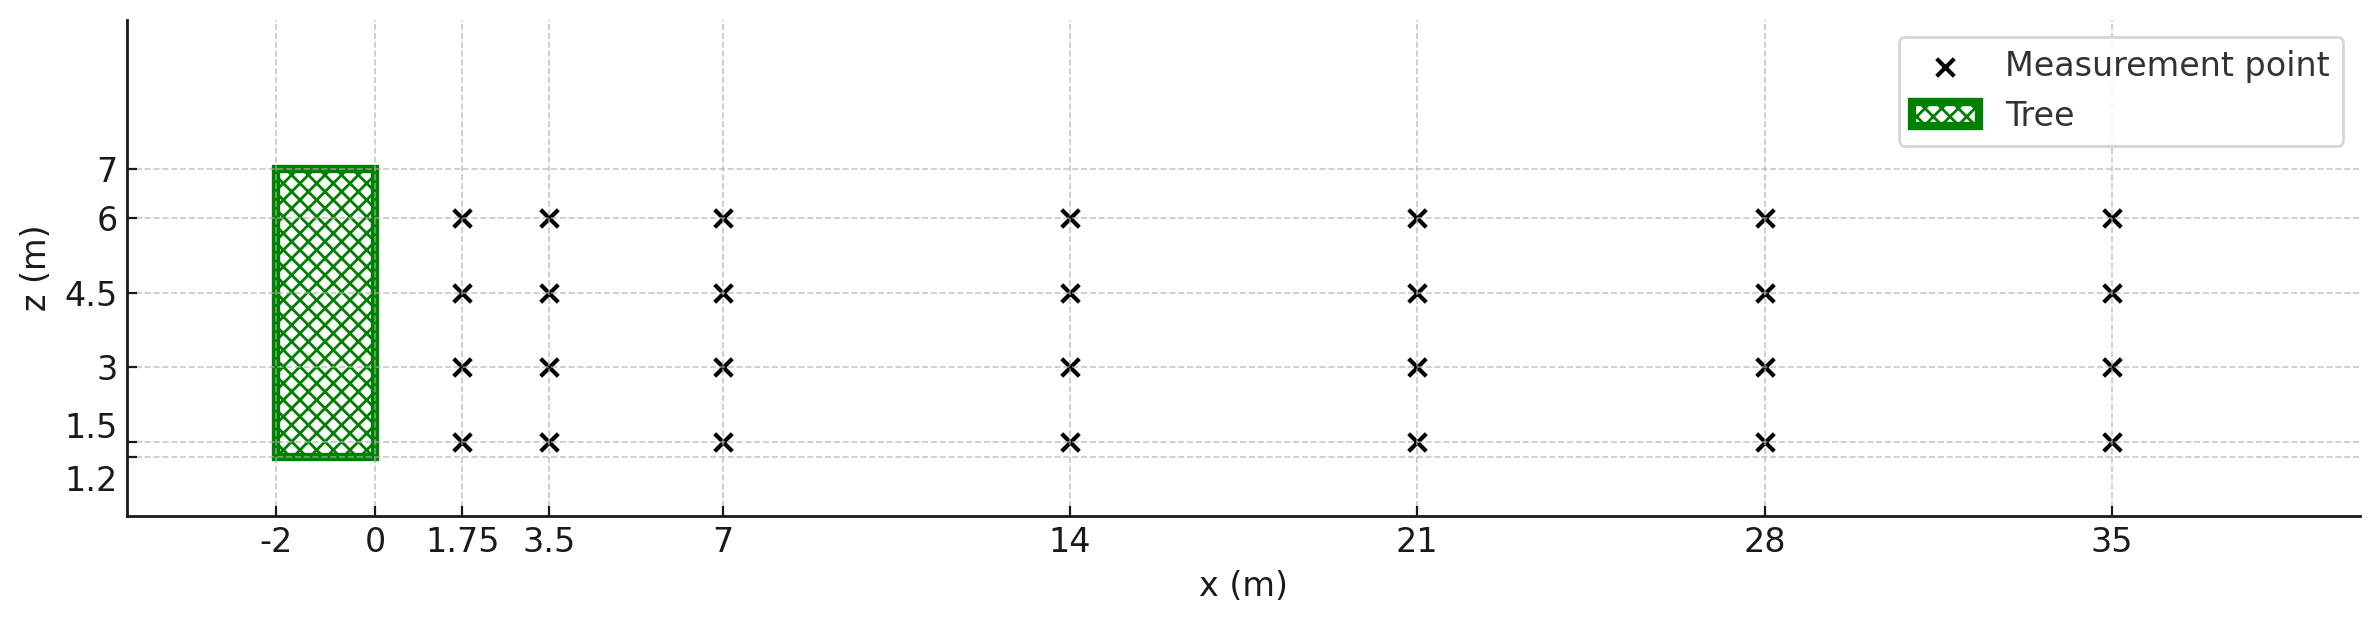
Figure G1. Measurement layout behind the pine belt: the hatched rectangle is the tree canopy (1.2–7 m); the crosses are the 28 field points (seven stations × four heights) used in the comparison. Figure from the AIJ Case G dataset (Zenodo, doi:10.5281/zenodo.15589666), CC BY 4.0.Figure G2. Vertical profiles of wind speed (U/UH) behind the pine belt at five distances downstream (x1/H = 1…5). Black dots: field measurements (Kurotani et al. 2001). Blue line: CityDigitalTwin. The shaded band marks the tree canopy (1.2–7 m).
AIJ Urban Wind Environment benchmark, Case G (field data, Kurotani et al. 2001)
TPU · Temperature
Building in stable and unstable air
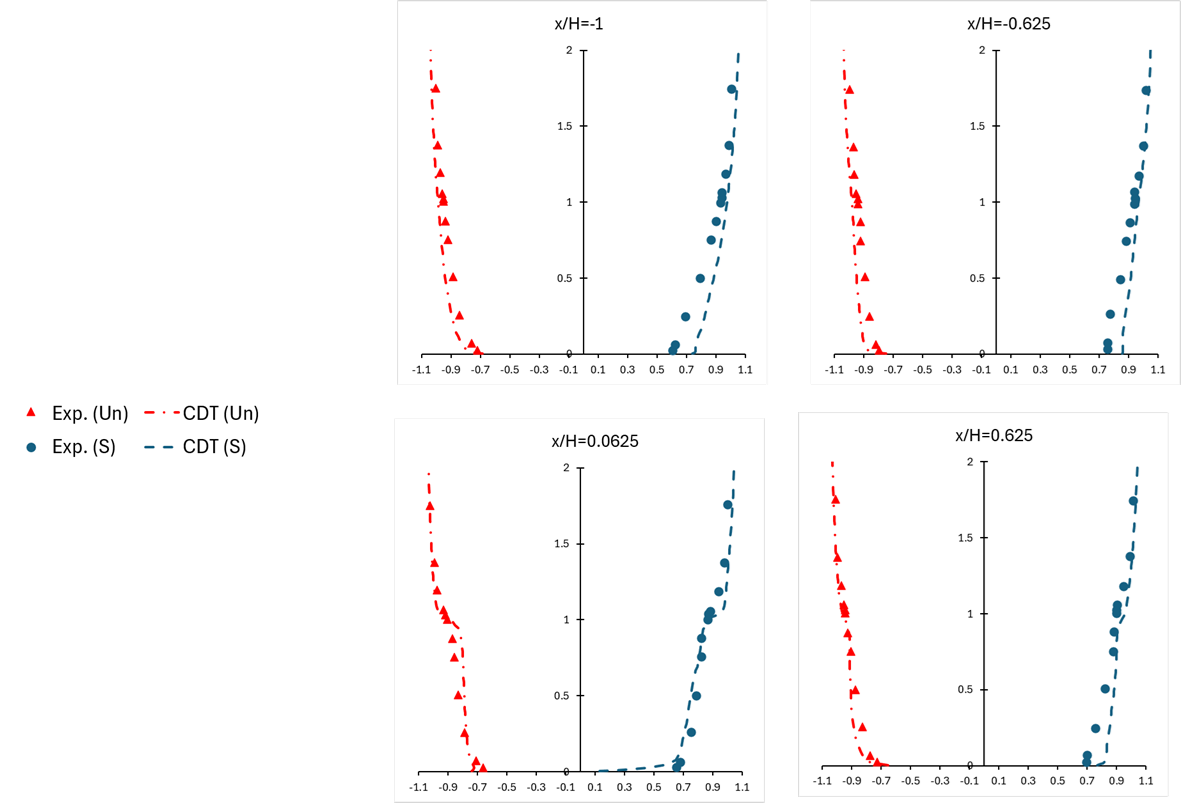
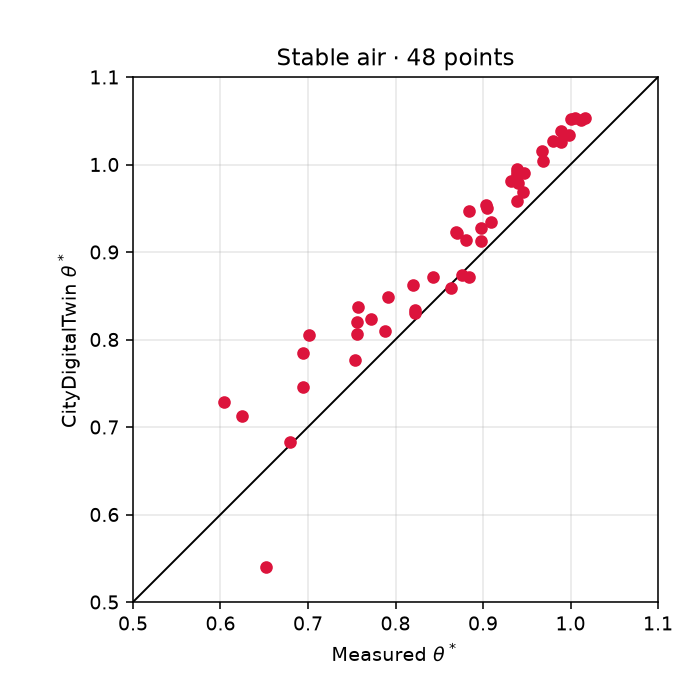
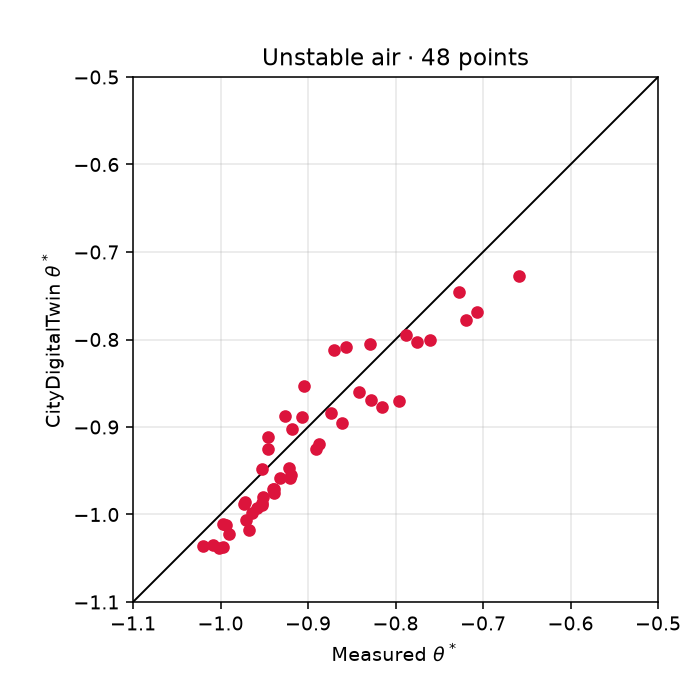
A 1:1:2 building in a wind tunnel whose floor is either colder than the approaching air (stable: 17.7 °C floor, 49.4 °C air) or warmer (unstable: 45.3 °C floor, 11.3 °C air). Air temperature is compared at 48 points on four vertical lines around the building, in each case.
The imposed temperature difference is 32–34 K, so the typical error is about 4–5% of it.
Stable air · 48 points
0.95R
1.7 KTemperature RMSE
Unstable air · 48 points
0.94R
1.2 KTemperature RMSE
Figure J1. Normalised air temperature θ* (horizontal axis) against height z/H (vertical axis) on the four measurement lines. Red: unstable case (warm floor, negative θ*); blue: stable case (cold floor, positive θ*). Symbols are wind-tunnel measurements; lines are CityDigitalTwin.
Figure J2. Stable case: CityDigitalTwin against the measured θ* at all 48 points. Points on the line agree exactly.Figure J3. Unstable case: the same comparison. θ* is negative because the floor is warmer than the approaching air.
Tokyo Polytechnic University wind-tunnel experiment (Yoshie 2016); measurements digitized from Bazdidi-Tehrani et al. (2018), J. Build. Perform. Simul. 12
Kato et al. · Humidity
Air flowing over open water
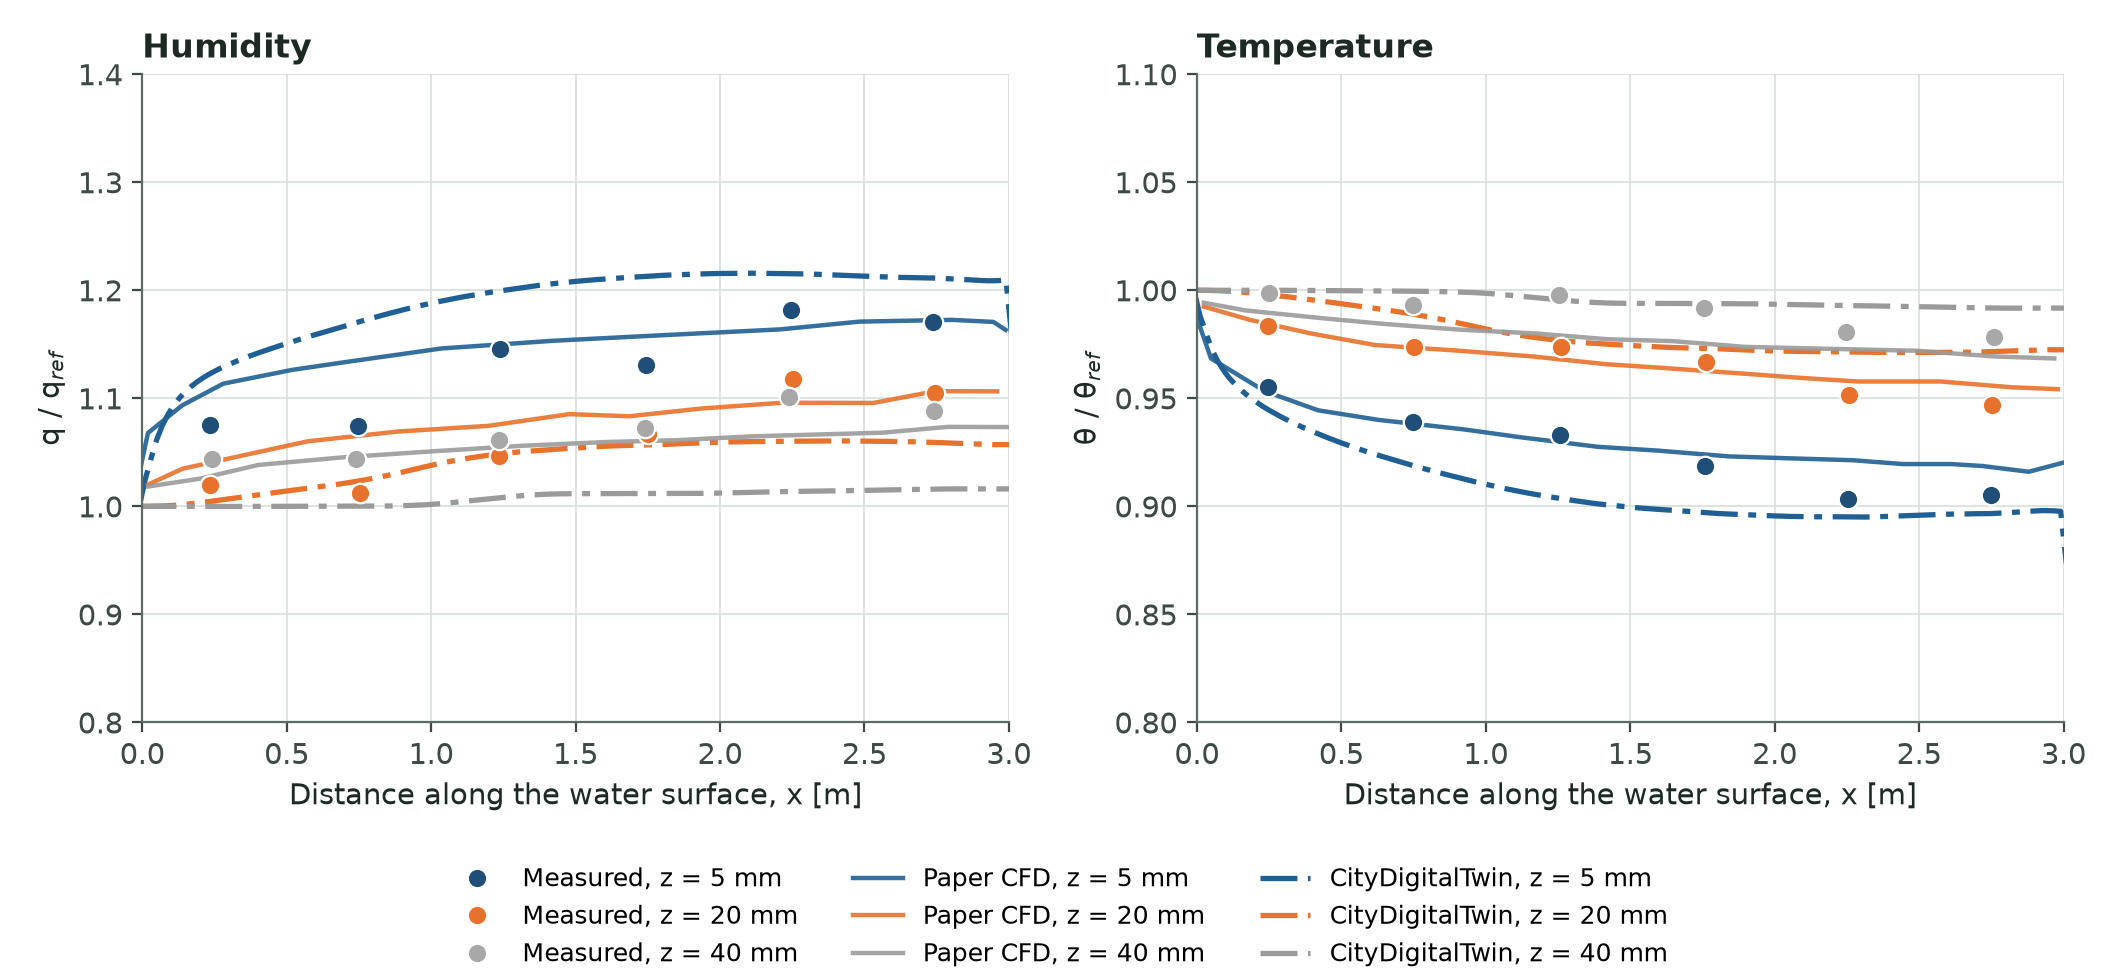
A wind tunnel whose whole floor is a 3 m water surface at 16 °C, under air at 20 °C flowing at 3 m/s. Over the water the air gains moisture and cools. Humidity and temperature are compared at three heights along the water, with every input taken from the experiment and nothing fitted.
Deviations are measured on the ratios q/qref and θ/θref, which change by up to about 20% and 10% over the water. For reference, the paper's own CFD model, built for this experiment, averages 1.4% on the same points.
Wind tunnel · 36 points
2.8%Mean deviation
1.3%Temperature
4.3%Humidity
Figure K1. Humidity (left) and temperature (right) along the water surface at 5, 20 and 40 mm above it, as ratios to the incoming air (q/qref, θ/θref). Dots: wind-tunnel measurements; solid lines: the paper's own CFD model; dash-dot lines: CityDigitalTwin.
Kato, Nakane & Yamada (2009) experiment, as reported in Tominaga, Sato & Sadohara (2015), Sustainable Cities and Society 19; measurements and the paper's CFD digitized from its Fig. 5
How results are scored
Each result is scored with the statistics used in the urban wind and microclimate literature, so it can be compared directly with other models.
R
Correlation
How closely the simulated pattern follows the measured one across all points. 1 means a perfect match.
FAC2
Factor of two
Share of points where the simulated wind speed is within a factor of two of the measurement.
U / UH
Normalised speed
Wind speeds are divided by the approach wind at building height, so a scale model and a real city can be compared on equal terms.
θ*
Normalised temperature
(T − Tfloor) / |Tair − Tfloor|: 0 at the floor temperature and ±1 at the approaching air temperature, negative when the floor is the warmer of the two.
RMSE
Typical error
The typical size of the difference from the measurement, in physical units: kelvin for temperature.
%
Mean deviation
The average difference from the measurement, as a percentage of the measured value.
Want to check the details?
Book a demo and we'll walk you through the benchmarks and how CityDigitalTwin performs on projects like yours.