Microclimate · Surface & energy · Wind · Daylight · Grid
CityDigitalTwin physically simulates how heat, wind, sun, building energy, and the power grid behave across a whole city — so architects, planners, and utilities can design cooler, healthier, more resilient places.
Why CityDigitalTwin
A new wave of tools predicts urban climate with AI models trained on simulation data — fast, but an approximation of an approximation, and unreliable the moment your design leaves their training set. CityDigitalTwin takes the other path: we solve the governing equations themselves, on GPUs, so real physics runs at the speed you'd expect from a shortcut.
ρ ( ∂u/∂t + (u·∇)u ) = −∇p + ∇·[(μ + μt)∇u] + f
ρcp ( ∂T/∂t + u·∇T ) = ∇·(k∇T) + q̇rad
Q̇HVAC = Q̇envelope + Q̇solar + Q̇internal + Q̇ventilation
Validated against field measurements and reference solvers — validation studies in preparation for publication. See the validation →
One platform, every scale
Most tools solve one slice of the urban climate problem. CityDigitalTwin couples them — microclimate, energy demand, and grid response in a single, physics-based model.
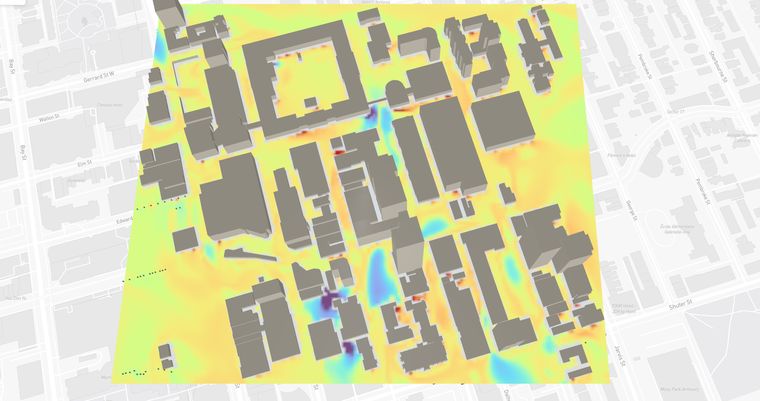
Heat-island mapping, air temperature, and thermal-comfort (UTCI) across every street and courtyard.
UTCI · MRT · Heat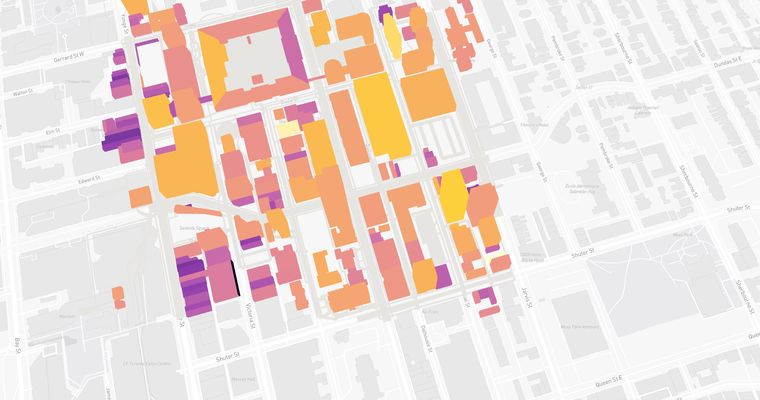
Whole-city UBEM for heating, cooling, and HVAC loads — building by building, hour by hour.
UBEM · HVAC · Loads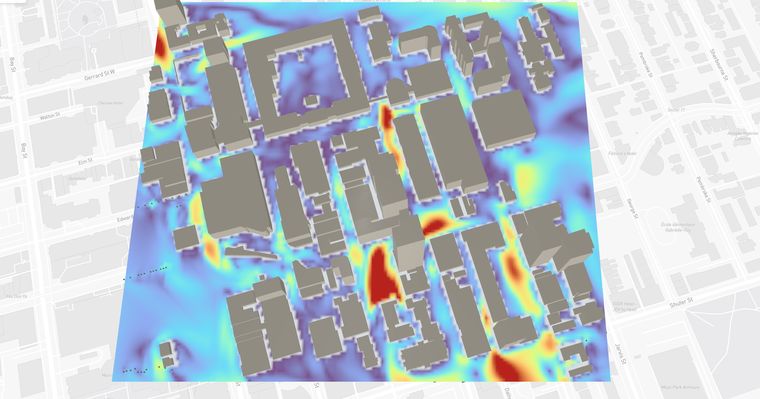
Pedestrian wind comfort and safety, ventilation corridors, and gust risk around towers.
CFD · Pedestrian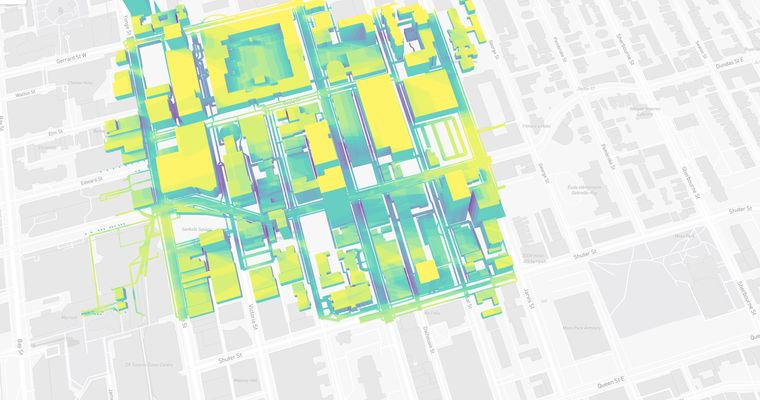
Solar radiation, daylight, and shadow studies to place mass, glazing, and green roofs precisely.
Sun hours · Daylight · SVF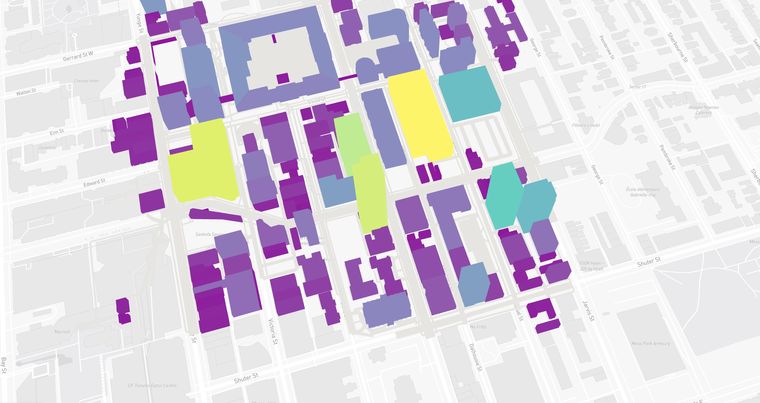
Track emissions and size PV, vegetation, and green infrastructure against real climate data.
CO₂e · PV · Green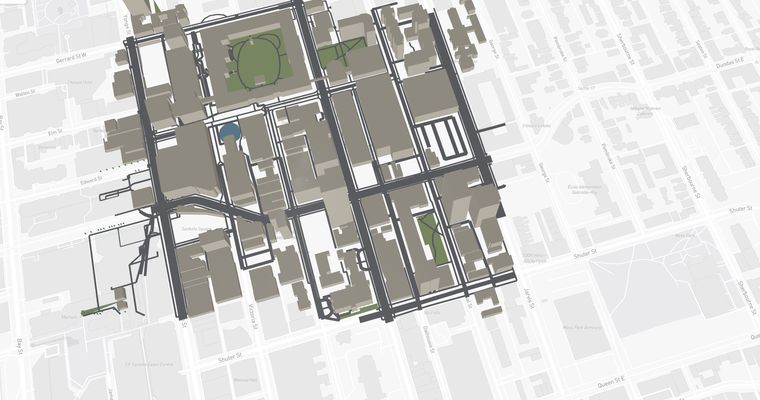
An automatic, georeferenced digital twin — buildings, roads, trees, grass, and water — ready to simulate.
Context · Terrain · VegetationThe digital twin
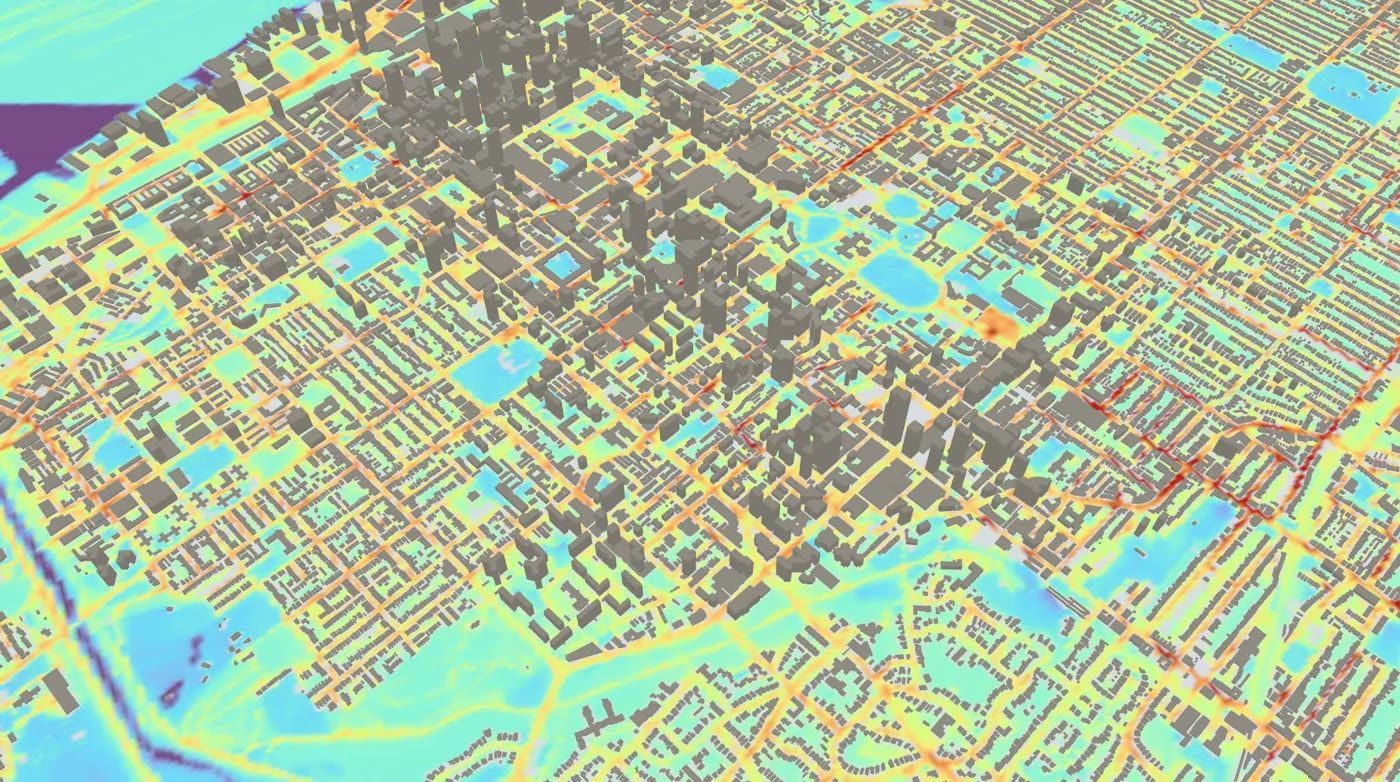
Upload your 3D city model — or generate one for anywhere on Earth — pick real weather, and run coupled microclimate and building-energy physics on GPU. Then explore every result right in the browser.
How it works
The whole workflow is self-serve, in the browser — no desktop software, no consultants, no hand-offs.
Upload your own 3D model, or generate one for any place on Earth — buildings, roads, trees, grass, and water, georeferenced automatically. Modelling in Rhino? Export directly with our free plugin.
Historical years, design days, or a real forecast up to 16 days ahead — so you can simulate next week's heatwave before it arrives.
Coupled microclimate and building-energy solvers run on a cloud GPU fleet that scales to your case — a courtyard or a whole city.
Slice, inspect, and chart every field in 3D or on the map, compare up to six scenarios with difference maps, and export the data.

Works with your workflow
A free plugin for Rhino 8. It exports your model as simulation-ready geometry — correct axes, metres, closed volumes, outward normals, ground on the datum — and carries your material assignments across as files you upload straight into a project. No cleanup, no re-modelling, no hand-tuning the STL.
_PackageManager and search CityDigitalTwin
or download the installer ↓
Rhino and Rhinoceros are registered trademarks of Robert McNeel & Associates.
Free companion tool
Not every model arrives ready to simulate. This free Windows app opens large
multi-solid STL city models — tested to 1.38 GB and about 7 million triangles —
and gets them into shape: crop to your study area, repair gaps and missing ground, add
trees, buildings, water and public-realm objects, assign CDT surface types, and export
a .cdt package ready to upload.
The app is not code-signed, so Windows shows “Windows protected your PC” the
first time. Click More info → Run anyway. Keep the folder together —
the program needs the _internal folder beside it.
Two ways to run it
The same physics, two deployments — use our managed GPU cloud, or run the engine on your own machines.
The full experience: browser-based 3D and map visualization, scenario comparison, PDF reports, and a managed GPU fleet that scales to your case. Nothing to install.
The same solvers — microclimate, building energy, and shading — running on your own workstation or cluster. Built for research groups and teams with their own hardware or data-residency requirements.
Who it's for
Different questions, same physics.
Evaluate development options for heat and comfort before approval, forecast heatwaves street-by-street up to 16 days ahead, and bring physics-based evidence to council and community.
Test massing, materials, shading, and green space while the design can still change — and compare up to six options side by side with difference maps. Model in Rhino? Export straight from it.
Deliver microclimate, energy, and wind-comfort studies faster — pedestrian-wind planning reports, raw VTK/CSV outputs, and GPU capacity without owning the hardware.
Hour-by-hour building-energy demand across an entire city — under this week's heatwave or a future climate — for load forecasting and demand-side planning.
Run the same engine on your own workstation or HPC with CityDigitalTwin Desktop — built for research groups and teaching labs.
What partners say
“PGL's CityDigitalTwin provides an accessible way for urban planners to understand development options in terms of microclimate effects.”
“We collaborated with Planète GreenLeaves on a thermal comfort and microclimate analysis to see how a proposed development project would affect the planted public spaces on New York's High Line. Their team brought deep technical expertise, responsiveness, and a strong commitment to quality. The insights they provided through detailed simulations were valuable in helping us assess climate-responsive design strategies. It was a pleasure working with them.”
Working with










Book a demo
See CityDigitalTwin run on your own site or district — microclimate, comfort, shading & daylight, and building energy, walked through in 30 minutes. Or explore the live demo cities yourself.